אמינות בתכנון מערכות אלקטרוניות: מהי המשמעות האמיתית של Mean Time Between Failures?
פורסם ב-אוקטובר 19, 2016
היצרנים והלקוחות נמצאים בחיפוש מתמיד אחר דרכים להבטיח את האמינות של מערכות אלקטרוניות. אחד מהמדדים היעילים בהתמודדות הזו נקרא Mean Time Between Failure, או בקיצור: MTBF

היצרנים והלקוחות נמצאים בחיפוש מתמיד אחר דרכים להבטיח את האמינות של מערכות אלקטרוניות. אחד מהמדדים היעילים בהתמודדות עם בעיות אמינות של מערכות אלקטרוניקה נקרא Mean Time Between Failure, או בקיצור: MTBF. סגן נשיא להנדסת יישומים בחברת CUI Inc, אינג' Jeff Smoot, מסביר לקוראי Techtime כיצד המדד הזה מאפשר לפתח מערכות אמינות יותר
Defining Reliability
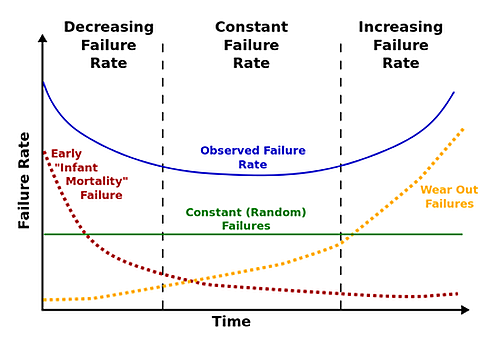
Before we can hope to improve the reliability of a product, such as a power supply, we need to understand that reliability is the probability that an individual unit of the product, operating under specified conditions, will work correctly for a specified period of time. This is not the same as failure rate, which is the proportion of manufactured units that will fail in a given time interval e.g. one failure from 1 million units in one hour. Failure rate is further complicated because typically it varies over the life of a product, following the so-called “bathtub” curve that exhibits a higher failure rate early and late in the product’s life, as shown in figure 1.
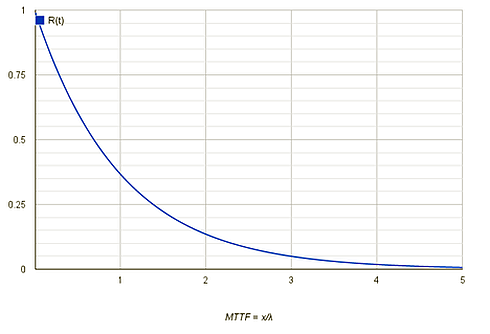
The intrinsic failure rate of a component, denoted λ, is defined as its failure rate during the constant failure rate part of its life-cycle. This in turn allows the definition of reliability, denoted R(t), over time t, as: R(t) = e-λt
MTBF and 37%
The inverse of failure rate, 1/ λ, provides what is known as the mean time to failure, or MTTF. However, while MTTF is technically the more correct term, MTBF (mean time between failures) is the more commonly used equivalent term, especially in the power industry.
The relationship between reliability, failure rate and MTBF give rise to some interesting observations. For example, a component with an intrinsic failure rate of 10-6 failures/hour (which is the same as an MTBF of 1 million hours) has a 90.5% probability of not failing within the first 100,000 hours. However this falls to 60.6% for the first 500,000 hours and the probability of the component lasting 1 million hours of use decreases to 36.7%, as illustrated by figure 2.
What this is really saying is that there is only a 37% confidence level that a component will last as long as its MTBF rating. It can also be seen that half the components in a group will have failed after just 0.69 of the MTBF. This realization becomes even more pertinent when extended from individual components to systems, for example taking account of all the components in a power supply where the failure rates of all components must be summed as: λA = λ1n1 + λ2n2 + … + λini
The number of components employed in a system, or sub-system such as a power supply, clearly reduces the overall MTBF. While selecting components with good MTBF figures can mitigate this result, it does highlight the intuitive conclusion that a system’s reliability can be no better than it’s least reliable component. Hence focusing on the weaker components can pay dividends.
An important takeaway from the above discussion is that the MTBF figure should not be used to predict the actual life of a power supply (or other component or system). This is a common mistake customers often make in attempting to interpret a product datasheet. Firstly, to reiterate the conclusion reached above, “there is only a 37% confidence level that a component will last as long as its MTBF rating”, added to which it is important to understand how an MTBF figure is arrived at, as we will see next.
Calculating MTBF
Determining the failure rate or MTBF of a component or system is key to understanding a product’s potential reliability. With a new product design some means of estimating or predicting life expectancy is required – simply building lots of units and running them for many hours under normal operating conditions is not a realistic method of obtaining meaningful results. That said, the use of accelerated life tests, where a product is operated at elevated temperature and under other stress conditions, can provide useful data and can also reveal areas of design weakness. The same is true for data obtained from the real service operation of equipment, which in turn contributes to an overall appreciation of a product’s reliability.
During development though, the only method available to a designer for calculating failure rate of an end‑product is prediction. This approach relies on component failure rate and expected life data provided by one of several standard databases, such as the US Navy’s MIL-HDBK-217 handbook, British Telecom’s HRD5 database or the Telcordia (formerly Bellcore) technical reference TR-332.
Whichever resource is chosen it is important to use it consistently, recognizing that their differing prediction methodologies were developed for different end-application requirements. For example, MIL-HDBK-217 focuses on military and commercial applications while, not surprisingly the Telcordia and BT methods are oriented to telecommunications designs and applications. The MIL approach depends on many component parameters and allows for voltage and power stresses to yield MTBF data. The Telcordia method depends on fewer component parameters but takes account of other data from laboratory tests, burn-in results and field tests. Also Telcordia produces FIT, or “failures in time”, numbers where one FIT equals one failure per billion (109) device-hours (equivalent to about 114,115 years) based on statistical projections from accelerated test procedures.
Unfortunately none of the aforementioned methodologies or sources of data guarantee absolute accuracy as each are based on assumptions that, at best, are somewhat inaccurate. One assumption is that the database is current and valid whereas the reality is these databases are quite old and don’t have data on newer components. In this case, the designer may have to go with the calculation method that best suits his purpose and either use data for the nearest equivalent part or rely on whatever reliability data the component manufacturer may provide, which may need to be treated with caution.
Conclusion
Product reliability is important and while some consumers may show blind faith in trusting reputable manufacturers, most would rather have the reassurance of a guaranteed product life. This in turn comes from manufacturers having confidence in their designs and in the components used to build those products.
As we have seen, it is important to avoid naively falling into the trap of wrongly assuming that the MTBF figure equates to the expected life of a product. Employing MTBF calculations allows the use of a consistent approach for comparisons to be made between products. The accuracy of the MTBF results, and thus the significance of the comparison, is heavily dependent upon the consistency of the assumptions and data bases used for the calculations.
For more information on reliability, visit: http://www.cui.com/power
כתבות נוספות העשויות לעניין אותך